Viewing Device Status on Monitor Page
The Web interface's Monitor page provides basic status and information on the device. The page is useful in that it allows you to easily obtain an overview of the device's operating status at a glance.
| ➢ | To view device status and information on the Monitor home page: |
| ■ | On the Menu bar, click Monitor or if you are already in the Monitor menu's Navigation tree, click |
The Monitor page displays the following groups of information:
| ■ | Device Information: |
| ● | Address: IP address of the device's OAMP interface |
| ● | Firmware: Software version currently running on the device |
| ● | Type: Name of the device |
| ● | S/N: Serial number of the device. |
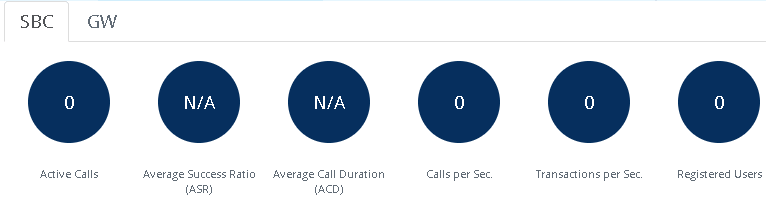
| ■ | SBC Call Statistics: |
| ● | Active Calls: Total number of SBC calls. The corresponding SNMP performance monitoring MIB is PM_gwINVITEDialogs. |
| ● | Average Success Rate (ASR): Number of successfully answered calls out of the total number of attempted calls. The corresponding SNMP performance monitoring MIB is PM_gwSBCASR. |
| ● | Average Call Duration (ACD): Average call duration in seconds of established calls. The value is refreshed every 15 minutes and therefore, this value reflects the average duration of all established calls made within a 15 minute period. The corresponding SNMP performance monitoring MIB is PM_gwSBCACD. |
| ● | Calls per Sec: Total number of new calls per second (CPS). |
| ● | Transactions per Sec: Total number of new SIP transactions per second (out-of-dialog transactions such as INVITE and REGISTER, or in-dialog transactions such as UPDATE and BYE). The corresponding SNMP performance monitoring MIB is PM_gwActiveSIPTransacionsPerSecond. |
| ● | Registered Users: Number of users registered with the device. The corresponding SNMP performance monitoring MIB is acPMSBCRegisteredUsersTable. |
SBC
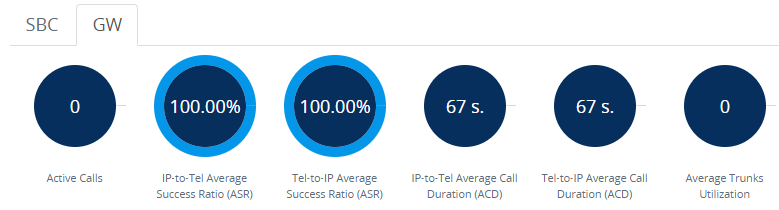
| ■ | Gateway Call Statistics: |
| ❖ | Active Calls: Total number of Gateway calls. The corresponding SNMP performance monitoring MIB is PM_ActiveContextCount. |
| ❖ | IP-to-Tel Average Success Ratio (ASR): The corresponding SNMP performance monitoring MIB is PM_gwAttemptedCalls. |
| ❖ | Tel-to-IP Average Success Ratio (ASR): Number of successfully answered Tel-to-IP calls out of the total number of attempted calls. The corresponding SNMP performance monitoring MIB is PM_gwAttemptedCalls / PM_gwEstablishedCalls. |
| ❖ | IP-to-Tel Average Call Duration (ACD): Average call duration in seconds of established IP-to-Tel calls. The value is refreshed every 15 minutes and therefore, this value reflects the average duration of all established calls made within a 15 minute period. The corresponding SNMP performance monitoring MIB is PM_gwCallDuration. |
| ❖ | Tel-to-IP Average Call Duration (ACD): Average call duration in seconds of established Tel-to-IP calls. The value is refreshed every 15 minutes and therefore, this value reflects the average duration of all established calls made within a 15 minute period. The corresponding SNMP performance monitoring MIB is PM_gwCallDuration. |
| ❖ | Average Trunks Utilization: Average number of trunks currently in use (busy). The corresponding SNMP performance monitoring MIB is PM_TrunkUtilization. |
| ■ | Graphical Display of device: Shows color-coded status icons, as shown in the figure below and described in the subsequent table: |
Graphical Display of Device (Example) on Monitor Page - Mediant 800 Multi-Service Business Router (MSBR)
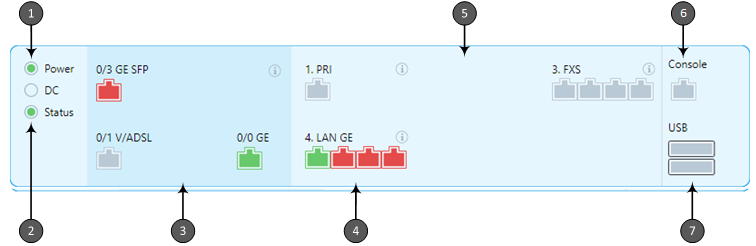
| ● | The figure above is used only as an example as the graphical display of your device in the Web interface reflects your specific ordered hardware configuration. |
Description of Graphical Display of Device on Monitor Page
|
Item #1 |
Description |
||||||||||||||||||||||||||||||||||||||||||||||||
|---|---|---|---|---|---|---|---|---|---|---|---|---|---|---|---|---|---|---|---|---|---|---|---|---|---|---|---|---|---|---|---|---|---|---|---|---|---|---|---|---|---|---|---|---|---|---|---|---|---|
|
1 |
Power LED icon, indicating power received by the device (green). Note: The DC LED icon is applicable only to Mediant 800C MSBR (if ordered with DC power). |
||||||||||||||||||||||||||||||||||||||||||||||||
|
2 |
Status LED icon, indicating operational status of the device by color:
|
||||||||||||||||||||||||||||||||||||||||||||||||
|
3 |
WAN port status icons, indicating WAN status by color:
To view a legend of the color-coded statuses, click the information Note: The type of WAN interface (e.g., DSL or fiber) depends on ordered hardware configuration. |
||||||||||||||||||||||||||||||||||||||||||||||||
|
4 |
Gigabit Ethernet (GE) LAN port icons, indicating LAN status by color:
To view a legend of the color-coded statuses, click the information To view detailed information, click the port icon to open the Network View page (see Viewing WAN and LAN Port Information). |
||||||||||||||||||||||||||||||||||||||||||||||||
|
5 |
Telephony port status icons:
To view a legend of the color-coded statuses, click the information To view detailed information, click the port icon to open the Trunks & Channels Status page (see Viewing Trunk and Channel Status).
To view a legend of the color-coded statuses, click the information To view detailed information, click the port icon to open the Basic Channel Information page (see Viewing Port Information). Note: The type and number of telephony port interfaces depend on ordered hardware configuration. |
||||||||||||||||||||||||||||||||||||||||||||||||
|
6 |
Console port icon, indicating the status of the serial interface:
|
||||||||||||||||||||||||||||||||||||||||||||||||
|
7 |
USB port
|